The BCG Matrix (Growth-Share Matrix), developed by the Boston Consulting Group in 1970, addresses a strategic question specific to firms with multiple business units or product lines: given limited investment capital, which businesses should receive continued investment, which should generate cash to fund others, and which should be reconsidered entirely? Unlike Five Forces or VRIO, which typically analyze a single business or resource, BCG is fundamentally a portfolio-level tool — and confusing single-business analysis with portfolio analysis is one of the most common conceptual errors MBA students make with this framework.
The Two Axes
The matrix plots each business unit or product line against two dimensions:
- Market growth rate (vertical axis) — how fast the overall market for this business is growing
- Relative market share (horizontal axis) — the business unit’s market share relative to its largest competitor, not simply its absolute share of the total market
This second point is frequently misunderstood: relative market share isn’t just “what percentage of the market do we have” — it’s specifically calculated as the firm’s market share divided by the largest competitor’s market share. A firm with 20% market share is in a very different competitive position if the largest competitor has 25% (relative share of 0.8) versus if the largest competitor has 10% (relative share of 2.0) — the second scenario indicates genuine market leadership, the first doesn’t, even though the firm’s own absolute share is identical in both cases.
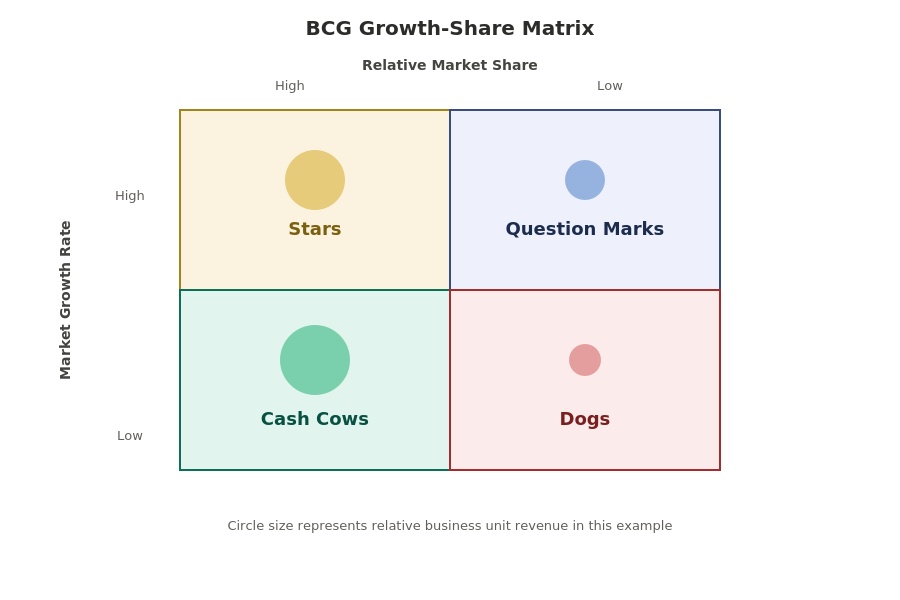
The Four Quadrants
Stars: high market growth, high relative market share. These are market leaders in growing markets — genuinely attractive positions, but typically requiring significant ongoing investment to maintain that leadership position as the market continues expanding and competitors invest to catch up.
Cash Cows: low market growth, high relative market share. Market leaders in mature, slow-growing markets — these businesses typically generate strong, stable cash flow with relatively modest reinvestment needs, since the market isn’t rapidly expanding and the leadership position is already well-established.
Question Marks: high market growth, low relative market share. Operating in attractive, fast-growing markets but without a leading position — these require a genuine strategic decision: invest heavily to build market share (potentially converting into a future Star), or divest if the investment required doesn’t appear likely to produce a leadership position.
Dogs: low market growth, low relative market share. Neither a growing market opportunity nor a leadership position — these businesses often warrant divestment or minimal further investment, though this isn’t automatic (see the limitations discussion below).
A Full Worked Example: A Diversified Consumer Goods Company
Scenario: A consumer goods company has four business units to evaluate for portfolio strategy.
Business Unit A — Premium Skincare Line: operates in a market growing at 12% annually; the unit holds 28% market share, while the largest competitor holds 15% (relative market share: 28/15 ≈ 1.87).
Classification: Star. High market growth, and a relative market share above 1.0 indicates genuine market leadership. Strategic implication: continued significant investment is likely justified to defend and build on this leadership position while the market is still expanding — cutting investment here risks ceding the growing market to competitors during the period when market position is still being established.
Business Unit B — Legacy Household Cleaning Products: operates in a market growing at only 1.5% annually (near-mature); the unit holds 35% market share, with the next largest competitor at 18% (relative market share: 35/18 ≈ 1.94).
Classification: Cash Cow. Strong leadership position in a slow-growth, mature market. Strategic implication: this business unit should be managed for cash generation — sustained profitability with modest reinvestment, using the resulting cash flow to fund investment in the company’s Star and promising Question Mark units, rather than aggressive further investment into a market with limited growth potential to capture.
Business Unit C — New Plant-Based Snack Range: operates in a market growing at 18% annually; the unit holds 6% market share, while the market leader holds 22% (relative market share: 6/22 ≈ 0.27).
Classification: Question Mark. Attractive, fast-growing market, but the company is far from a leadership position. Strategic implication: this requires an explicit decision — is there a credible path to significantly increased market share (through investment in marketing, distribution, or product differentiation) that would justify the resources required, or does the gap to the market leader make that investment unlikely to pay off, favoring divestment or a more limited, cash-conserving approach instead?
Business Unit D — Traditional Bar Soap: operates in a market growing at 0.5% annually (essentially flat/declining); the unit holds 8% market share, with the market leader at 30% (relative market share: 8/30 ≈ 0.27).
Classification: Dog. Low growth, low relative share. Strategic implication: absent some specific strategic reason to retain it (discussed in the limitations section below), this business unit is a candidate for divestment or minimal maintenance, since it neither generates the cash flow of a Cash Cow nor the growth potential of a Star or promising Question Mark.
The Strategic Logic Connecting the Quadrants
The BCG Matrix isn’t just a static classification exercise — its real strategic value comes from thinking about cash flow across the portfolio: Cash Cows (Business Unit B) generate more cash than they need for reinvestment, and that surplus cash can fund the heavy investment needs of Stars (Business Unit A) and selectively chosen Question Marks (potentially Business Unit C, if the strategic case is strong) — while Dogs (Business Unit D) are evaluated for whether they’re worth continued resource allocation at all. This cash-flow-balancing logic across a whole portfolio is the framework’s central strategic insight, well beyond simply sorting business units into four labeled boxes.
Common Limitations and Criticisms (Important for Critical MBA Analysis)
A strong MBA-level treatment of BCG doesn’t just apply the framework — it also critically evaluates its limitations:
- Market growth rate isn’t the only indicator of market attractiveness — a slow-growth market can still be highly profitable and attractive for other reasons (high margins, stable demand, limited competitive intensity), which a pure growth-rate axis doesn’t capture
- The framework doesn’t account for synergies between business units — a “Dog” business unit might still be strategically valuable if it supports the brand, customer relationships, or supply chain of other units in the portfolio, a consideration BCG’s simple two-axis classification misses entirely
- Relative market share as a proxy for profitability has been questioned — the original BCG logic assumed market share leadership directly produces cost advantages (via experience curve effects), but this relationship doesn’t hold uniformly across all industries
- The matrix provides a snapshot, not a trajectory — a Question Mark’s future depends heavily on strategic choices and market evolution the matrix itself doesn’t predict; it identifies the current strategic question without answering it
Worked example of a limitation in practice: Business Unit D (Traditional Bar Soap) might appear a clear divestment candidate by BCG classification alone, but if it shares manufacturing infrastructure, raw material sourcing, or retail shelf-space relationships with Business Unit B (the Cash Cow), divesting it could disrupt cost efficiencies or retail relationships benefiting the more strategically important units — precisely the kind of cross-unit synergy consideration that a purely mechanical application of BCG classification would miss, and that a genuinely strong MBA analysis should explicitly raise.
Common Student Mistakes
- Confusing relative market share with absolute market share — as shown above, these can produce completely different classifications for the same absolute share percentage depending on the competitive context
- Applying BCG to a single product’s features rather than portfolio-level business units — BCG is a portfolio tool comparing multiple business units against each other, not a framework for analyzing one product’s internal attributes
- Treating “Dog” classification as an automatic, unconditional divestment recommendation — as the limitations discussion shows, cross-unit synergies and other strategic considerations can justify retaining a Dog-classified unit
- Ignoring the cash-flow logic connecting quadrants — a strong analysis explains how cash generated by Cash Cows should fund Stars and selected Question Marks, not just classify each unit independently
- Presenting BCG analysis without acknowledging its well-documented limitations — critical engagement with the framework’s weaknesses (as covered above) typically strengthens an MBA-level strategic analysis rather than weakening it
When applying the BCG Matrix in coursework, students may also find strategic management study materials useful for understanding how portfolio analysis can be developed into a broader strategic argument. MBA Strategic Management Resources offers additional guidance related to strategic management analysis and assignment structure.
Frequently Asked Questions
How is the BCG Matrix different from the Ansoff Matrix? Ansoff addresses growth strategy options (which products, which markets) generally at a strategic-direction level; BCG addresses portfolio resource allocation across multiple existing business units based on their current market growth and competitive position — they answer different strategic questions and are often used at different stages of strategic planning.
What happens to a Question Mark business unit over time? It typically evolves in one of two directions: successful investment and market share gains can convert it into a Star, while failure to gain share (or a decision not to invest further) often sees it decline toward Dog status as the market matures and growth slows.
Is a Cash Cow always a low-priority business unit? No — Cash Cows are often critically important to overall corporate strategy precisely because they fund investment elsewhere in the portfolio; “low priority for further investment” is not the same as “strategically unimportant.”
Can the BCG Matrix be applied to a single-product company? Not meaningfully in its intended form — the framework’s value comes from comparing multiple business units against each other for portfolio resource allocation decisions; a single-product firm has no portfolio to allocate resources across, making other frameworks (like Five Forces or Generic Strategies) more appropriate for that context.