The Ansoff Matrix, developed by Igor Ansoff in 1957, remains one of the most widely used frameworks for structuring growth strategy decisions — it forces a firm to explicitly answer a deceptively simple question before pursuing growth: are we selling existing or new products, and are we selling to existing or new markets? The four resulting quadrants carry sharply different risk profiles, and understanding why risk escalates across the matrix, not just memorizing the quadrant names, is what turns this into a genuinely useful strategic tool rather than a simple classification exercise.
The Matrix Structure
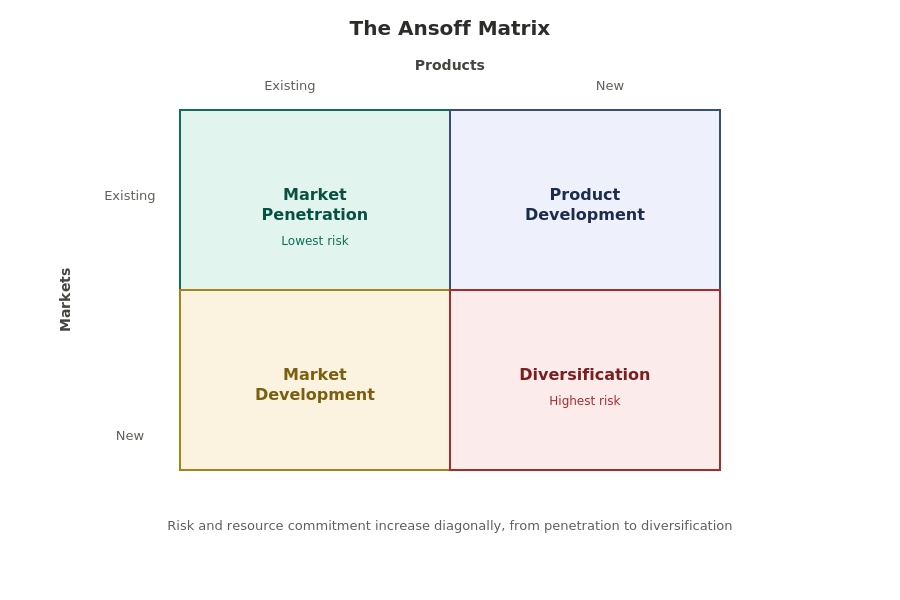
The Ansoff Matrix crosses two dimensions — products (existing vs new) and markets (existing vs new) — producing four growth strategies:
Market Penetration: Existing Products, Existing Markets
The lowest-risk quadrant — growing by selling more of what the firm already offers to markets it already serves. This typically involves increasing market share through more aggressive marketing, competitive pricing, loyalty programs, or increased usage frequency among existing customers.
Worked example: A coffee chain introduces a loyalty app offering a free drink after every ten purchases, aiming to increase visit frequency among its existing customer base in markets where it already operates. No new product is introduced, and no new customer segment or geography is targeted — the strategy is purely about deepening penetration within the current business.
Why this is lowest risk: the firm already understands the product, the customers, and the competitive dynamics — execution risk exists (a loyalty program might underperform expectations), but the fundamental market and product uncertainties present in the other three quadrants are absent.
Product Development: New Products, Existing Markets
Growing by introducing new products or significantly modified offerings to the firm’s existing customer base — leveraging established customer relationships and market knowledge while accepting the risk associated with product innovation itself.
Worked example: A smartphone manufacturer with an established customer base launches a new wireless earbuds product line, targeting existing customers who already trust and purchase from the brand. The market (existing smartphone customers) is familiar, but the product itself carries genuine development, manufacturing, and market-acceptance risk.
Key risk factor: product development risk is largely internal and controllable to a degree (R&D quality, manufacturing execution) but still carries genuine uncertainty about whether the new product will actually be adopted by the existing customer base at the scale needed to justify investment.
Market Development: Existing Products, New Markets
Growing by taking an already-proven product into new markets — this could mean new geographic regions, new customer segments, or new distribution channels for an existing, unmodified (or only lightly adapted) product.
Worked example: A UK-based fashion retailer with a successful existing product range expands into the German market, using largely the same product catalog but adapting marketing, logistics, and potentially some product sizing to the new market’s requirements. The product itself is proven; the new market introduces genuine uncertainty (different consumer preferences, competitive landscape, regulatory requirements, and brand recognition starting from zero).
A frequently underestimated risk: market development risk isn’t just “will people buy this here” — it also includes operational risks (new distribution and logistics relationships, potentially new regulatory compliance requirements) that a purely product-focused analysis can overlook.
Diversification: New Products, New Markets — The Highest-Risk Quadrant
Growing by introducing new products into new markets simultaneously — this is the highest-risk quadrant precisely because the firm loses the risk-mitigating benefit of familiarity on both dimensions at once. Diversification is further divided into two sub-types:
Related diversification: the new business shares meaningful commonality with the firm’s existing operations (similar technology, supply chain, distribution channels, or customer knowledge), even though the specific product and market are both new.
Worked example: An airline launches a hotel booking and vacation package business — a genuinely new product (accommodation booking) in a genuinely new market segment (leisure package travelers rather than purely flight customers), but one that shares meaningful synergies with the airline’s existing travel industry relationships, customer data, and brand trust in travel-related purchases.
Unrelated diversification: the new business shares little or no meaningful connection to the firm’s existing operations.
Worked example: A soft drink manufacturer acquiring a film production studio — genuinely new product, genuinely new market, with minimal operational, customer, or capability overlap with the existing beverage business. This represents the highest-risk end of the entire matrix, since the firm brings little transferable advantage into the new venture.
Why the related/unrelated distinction matters for MBA analysis: simply labeling a strategic move “diversification” is analytically thin. A strong analysis specifically identifies what, if anything, transfers from the existing business (brand trust, distribution relationships, technical capability, customer data) — related diversification carries meaningfully lower risk than unrelated diversification precisely because of this transferable foundation, even though both technically sit in the same matrix quadrant.
Connecting Ansoff to Risk and Resource Commitment
A useful way to synthesize the whole framework for strategic analysis: risk and required resource commitment generally increase as a firm moves diagonally across the matrix, from market penetration (lowest risk) toward unrelated diversification (highest risk). This isn’t an arbitrary ranking — it reflects the genuine compounding uncertainty of operating with less established knowledge on both the product and market dimensions simultaneously.
Practical strategic implication: a firm with limited risk tolerance or resources might deliberately sequence growth strategies — building market share through penetration first, then expanding into adjacent products or markets incrementally, rather than attempting ambitious unrelated diversification without first establishing a strong base. This sequencing logic is exactly the kind of applied strategic reasoning that distinguishes a strong MBA analysis from simply plotting a company’s activities onto the four quadrants descriptively.
For students working through growth-strategy frameworks in an academic context, additional MBA strategy assignment resources can help with applying models such as the Ansoff Matrix to real business cases. Strategic Management Study Support provides further guidance on developing and structuring strategic management assignments.
Common Student Mistakes
- Treating the matrix as purely descriptive rather than analytically applying the risk implications — correctly identifying which quadrant a strategy falls into is only the starting point; the stronger analysis explains the resulting risk profile and its strategic implications
- Failing to distinguish related from unrelated diversification — both technically occupy the same quadrant, but their risk profiles differ substantially, and treating them identically weakens the analysis
- Assuming market penetration is always the “safe default” appropriate for every situation — in a saturated or declining market, market penetration may offer limited genuine growth potential regardless of its lower risk profile, making other quadrants strategically necessary despite their higher risk
- Ignoring resource and capability requirements when recommending a growth strategy — a strong analysis considers not just which quadrant a firm could pursue, but whether it has (or can realistically acquire) the resources and capabilities the chosen strategy requires
- Using Ansoff in isolation without connecting to other frameworks — a well-rounded strategic analysis often uses VRIO to assess whether a firm has the resource base to support a given growth strategy, or Five Forces to assess whether a target new market is structurally attractive
Frequently Asked Questions
Is diversification always a poor strategic choice given its higher risk? No — higher risk doesn’t mean the strategy should never be pursued; it means the decision requires more rigorous justification and risk mitigation than lower-risk quadrants, and related diversification in particular can be a strong strategy when genuine synergies with existing capabilities exist.
Can a company pursue multiple Ansoff quadrants simultaneously? Yes, and many large diversified firms do — different business units or product lines can each occupy different positions on the matrix at the same time, provided the firm has adequate resources and organizational capacity to manage multiple growth strategies concurrently without losing strategic focus.
How is the Ansoff Matrix different from Porter’s Generic Strategies Ansoff addresses where growth should come from (which products, which markets), while Porter’s Generic Strategies addresses how a firm competes within its chosen market (on cost or differentiation) — the two frameworks answer different strategic questions and are often used together rather than as alternatives.
Does market development always mean international expansion? No — market development can also mean targeting a new customer demographic, new distribution channel, or new use-case within the same geography, not exclusively international or geographic expansion; international expansion is simply one common example of market development, not its definition.